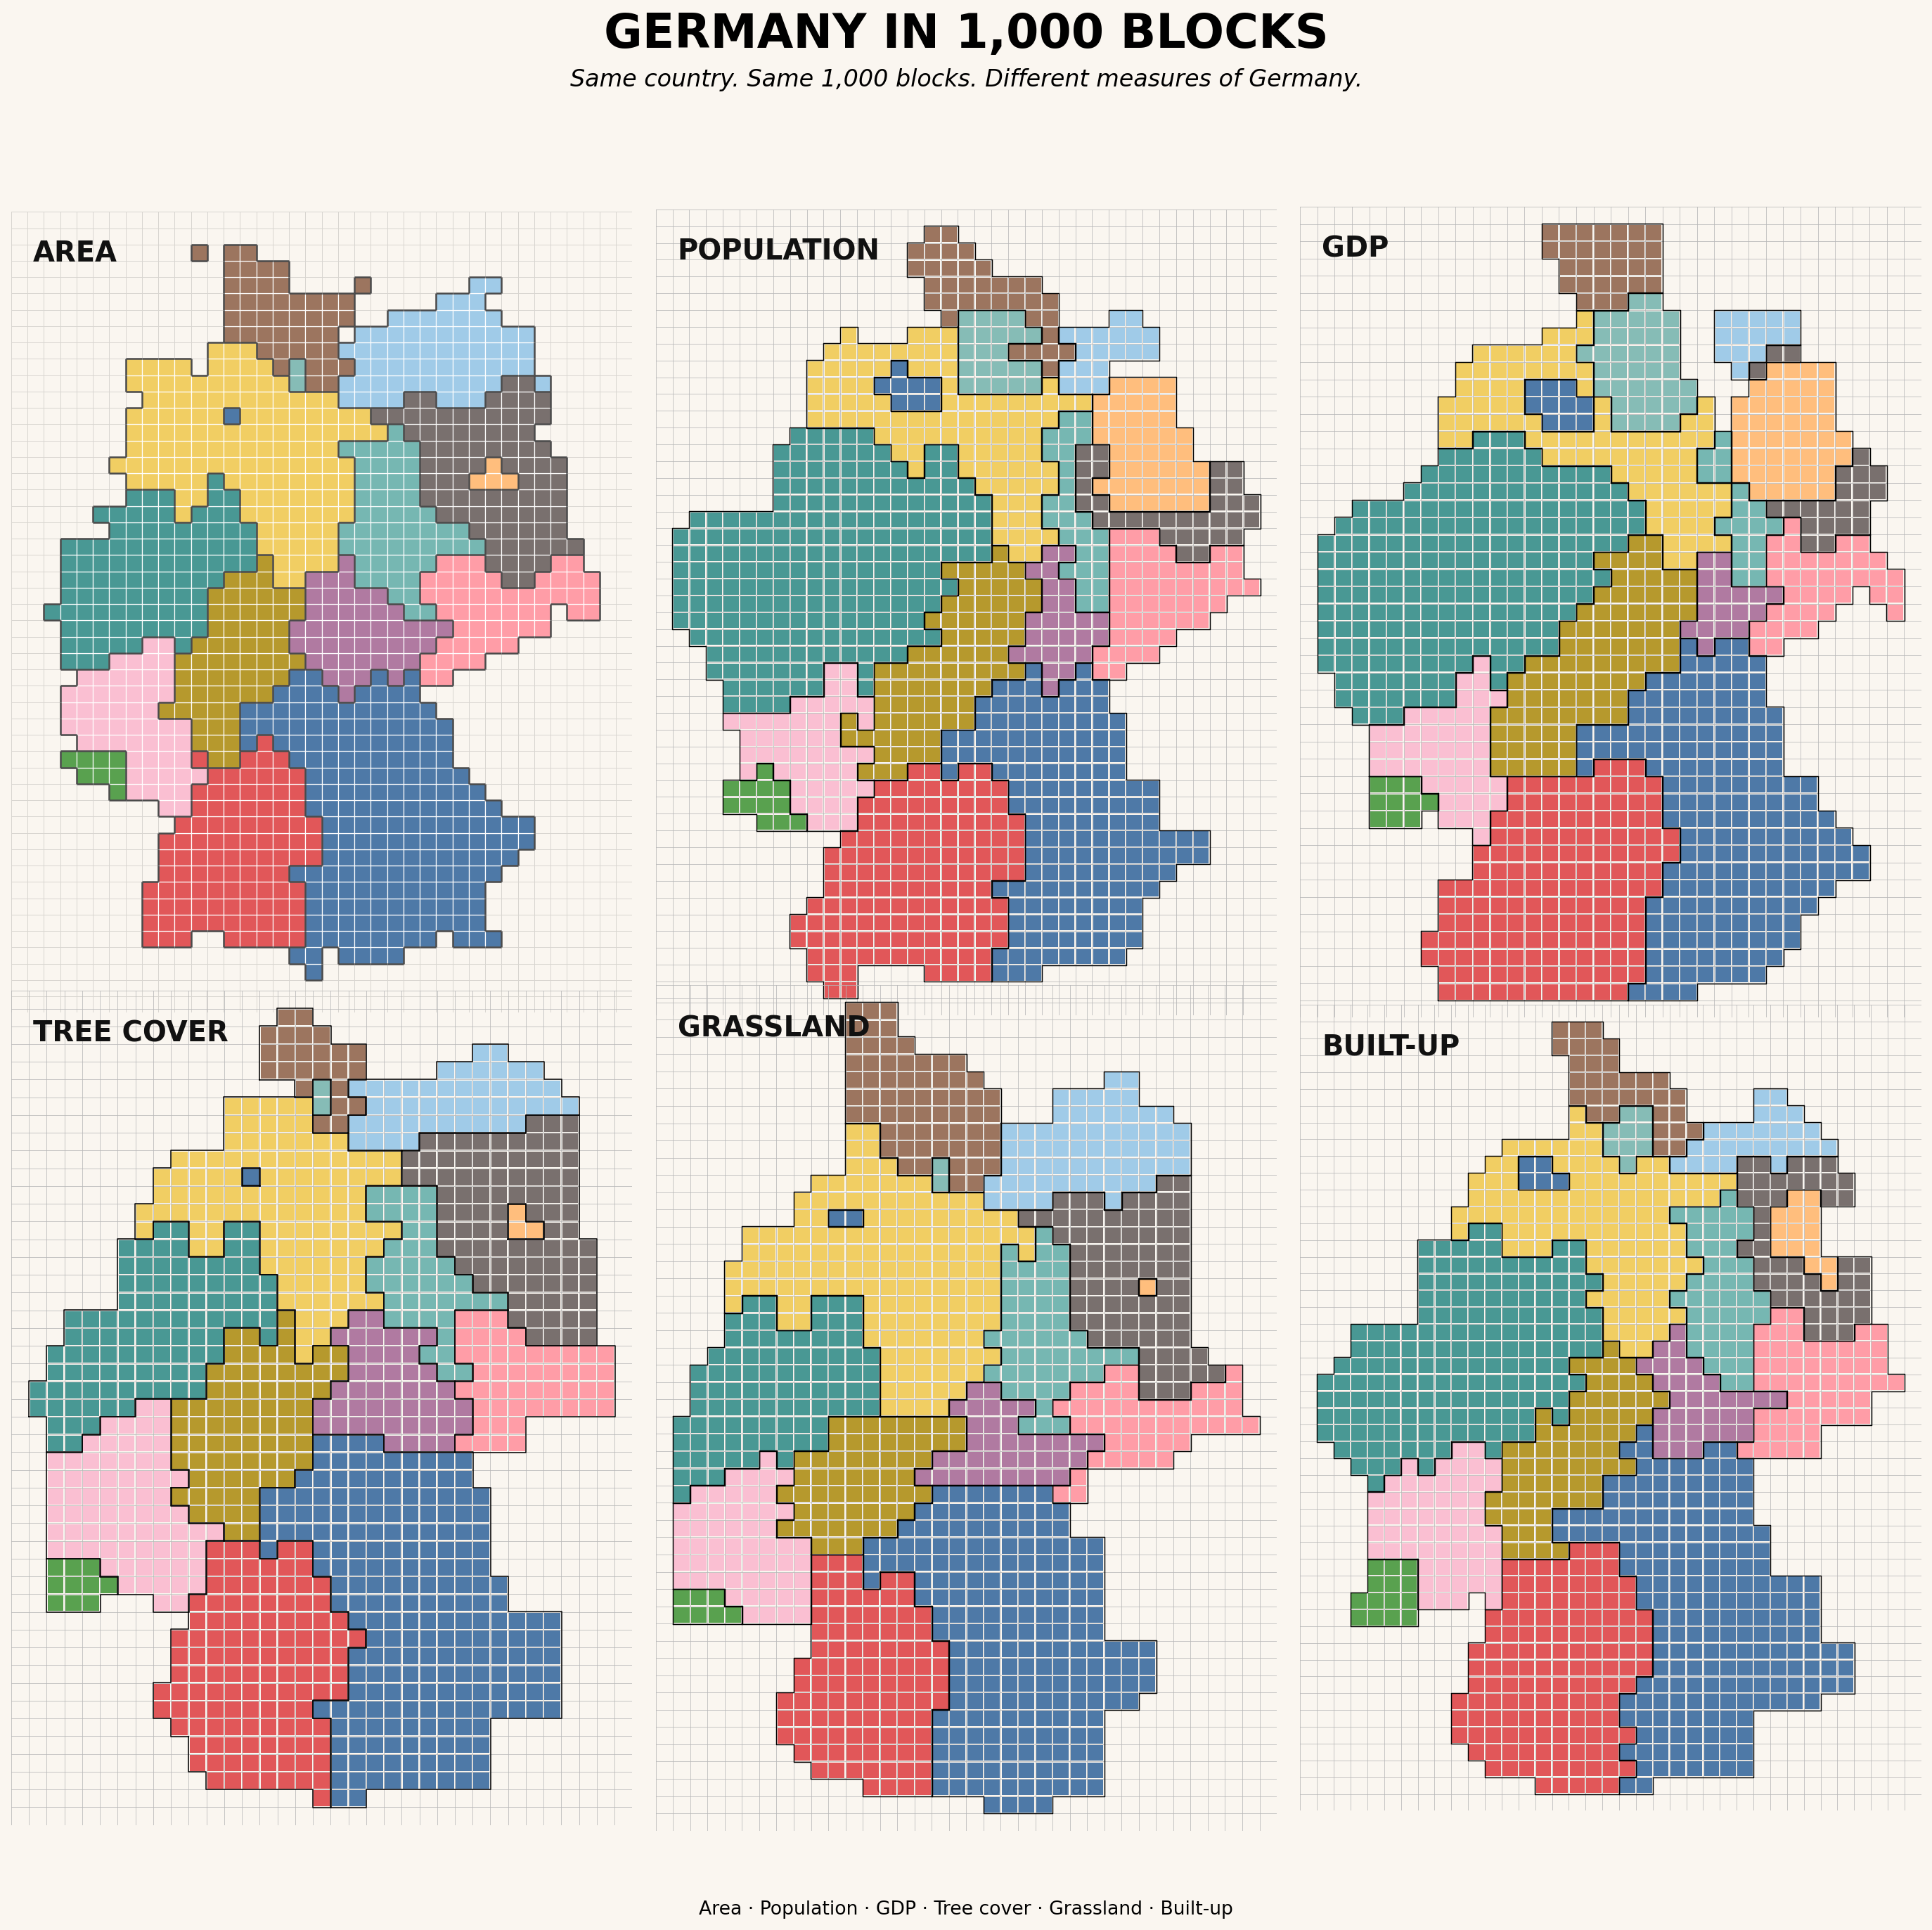
Same country. Different measures.
What if we keep the same 1,000 blocks, but change what those blocks represent?
Land area gives one Germany. Population, GDP, tree cover, grassland, and built-up land give five others.
For me, the interesting part is not the distortion itself, but the questions it creates:
Where do people, economic activity, and environmental resources align — and where do they not?
The same approach could be extended to heat exposure, air pollution, energy, infrastructure, climate risk, or other dimensions of human–environment interactions.
A map does not always have to provide the answer. Sometimes its value is making a better research question visible.
Data and tools
- Population: German Federal Statistical Office (Destatis), population by federal state, 31 December 2021
- GDP: German Regional Accounts (VGRdL), GDP by federal state, 2021, current prices
- Land cover: ESA WorldCover 2021 v200, 10 m
- Spatial processing: GeoPandas
- Block cartograms:
popgrid